ATOMIC & OPTICAL PHYSICS LABORATORY
Department of Physics & Astronomy, State University of New York (SUNY) at Oswego
Our Focus
Our group focuses on research in both fundamental physics as well as applications. On the fundamental physics side, we conduct research in precision atomic structure measurements (hyperfine constants, isotope shifts, etc.) of heavy atoms. Precise measurements of the internal energy structure of atoms play an essential role in validating existing atomic theories and helping to develop state-of-the-art theoretical models related to atomic physics. On the applications side, we study Electromagnetically Induced Transparency (EIT) in atomic systems. EIT is a phenomenon in which a strong control/coupling laser is used to modify the properties of the medium for a weak probe laser. EIT can be used to slow and store light in an atomic medium and hence has a potential application in quantum memory development in the field of quantum computing. It can also be used to detect RF-electric fields and has potential applications in developing RF-field sensors. Our current candidates are Group IA: Rubidium, Cesium and Group IIIA: Gallium.
-
Direct Absorption Spectroscopy

Figure 1: Direct absorption spectroscopy
In direct absorption spectroscopy, a laser beam transmitted through an atomic vapor cell is directed towards a photodetector. When the laser frequency is tuned such a way that its energy matches the energy difference between two atomic energy levels, the atom will absorb the energy from the laser beam (i.e. the outer-most loosely bound valance electron will absorb energy and as a result it will jump into a higher energy level so that the atom is excited) and as a result the transmitted power of the beam is reduced. In other words, if we check the transmitted power of the beam while the laser is scanning (ramping frequency) it will show a power drop (an absorption dip) as shown in the figure 2. Since the atoms are in motion inside the vapor cell (similar to a gas) this signal is typically so broad (Doppler broadening).
This signal depends on atomic density N, length of the cell L and frequency dependent absorption cross-section \sigma. The product of these three quantities is called the optical depth (OD). For small optical depths, the signal may be modeled numerically using the Voigt line shape.
Figure 2: Typical Doppler broadned direct absorption spectra for small optical depth.

-
Saturated Absorption Spectroscopy

Figure 3: Saturated absorption spectroscopy setup
In saturation absorption spectroscopy, two low power laser beams transmitted through an atomic vapor cell is directed to a differential photodiode which produce an electric signal proportional to the power difference of the incident laser beams. When the laser frequency is tuned such a way that its energy matches the energy difference between two atomic energy levels, the atom will absorb the energy from the laser beam and as a result the transmitted power of the beam is reduced. In other words, if we check the transmitted power of one of the beams while the laser is scanning (ramping frequency) it will show a power drop (an absorption dip). Since the atoms are in motion inside the vapor cell (similar to a gas) this signal is typically so broad (Doppler broadening) such a way that we cannot resolve individual dips correspond to hyperfine transitions (see figure 3 -right for an example). All of these dips are embedded in one broad absorption dip as shown in the figure 4(a).
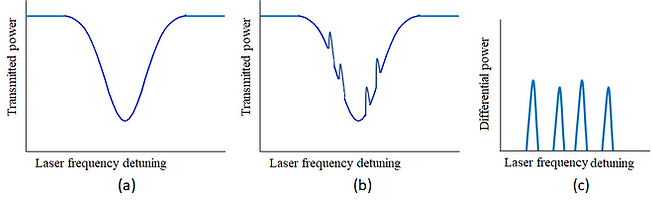
Figure 4: (a) direct absorption signal, (b) direct absorption signal with high power beam present, (c) Differential signal ((b) - (a))
However, when a strong (high power) counter propagating beam is present with one of the low power beam (see figure 3 for low-power, high-power overlapping beams) atom absorbs more energy from the strong beam than the weak low power beam when the laser frequency matches either of atomic hyperfine transition energies . In other words, low beam shows less absorption at those occasions and produce a signal as shown in the figure 4(b) at the photodetector. Use of differential photodiode allows us to create a difference signal (subtract 8(a) from 8(b)) and extract a signal which contain significantly narrow peaks corresponding to all hyperfine transitions described above (see figure 3; right for an example). This technique also helps us to reject common mode noise associated with individual signals. A typical signal may look like the one shown in figure 4(c). This signal may be fitted with sum of Lorentzian line shapes to determine the center positions of the peaks with high accuracy and hence provide the differences between peaks which correspond to hyperfine splittings measurement.
NOTE: Additional (cross-over) peaks may be observed.
-
Two-Step (two-photon) Absorption Spectroscopy
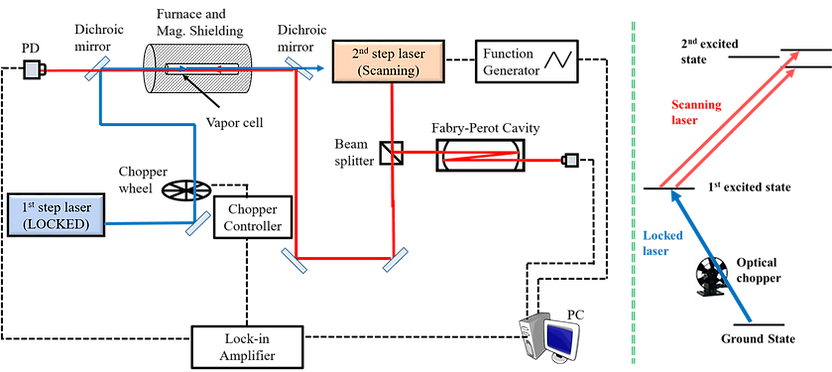
Figure 5: Two-step absorption spectroscopy setup
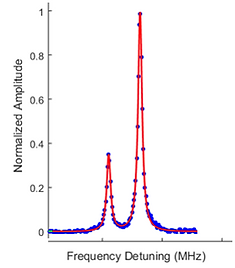
In two-setup excitation, the fist step laser is locked to the relevant 1st step transition (this locking-setup is not shown here for the clarity) and another 2nd step laser is scanned across the targeted 2nd excited state hyperfine levels. Both beams are overlapped in the vapor cell (interaction region). The direct 2nd step absorption signal is so week (~1% of 1st step absorption) such that hyperfine absorption dips are almost impossible to observe. This problem can be solved by employing a phase sensitive detection technique. We chop the 1st step laser beam using an optical chopper wheel and detect the 2nd step absorption signal oscillating at chopped frequency using a lock-in amplifier. The technique allows us to detect extremely small absorption dips embedded in the noise which is almost impossible to detect otherwise. The typical spectra corresponds to two 2nd excited state hyperfine levels is shown in the figure 6.
Figure 6: Typical 2-hyperfine level spectra observed using two-step phase sensitive detection. These Doppler-free spectra may be modeled by Lorentzian line shape. Such a fit is also shown here in red.
-
Electromagnetically Induced Transparency (EIT)
EIT is a phenomenon in which a strong laser beam (control beam) is used to modify the absorption and dispersion properties of an atomic medium for a weak laser beam (probe beam) transmission across the medium. EIT can be used to slow down and even store light in a medium in a controllable fashion and hence has potential applications in many fields including telecommunication (Optical delay lines), quantum computing (quantum memory development), and atom-based sensors (RF electric field detection).
EIT is studied in three different configurations. Our current focus is Lambda-type EIT in cesium.
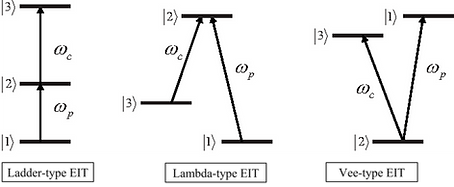
Figure 7: EIT configurations. ωp and ωc represent Rabi frequencies for pump and probe lasers. Dipole allowed transitions: |1> → |2> and
|2> → |3>. Dipole forbidden transitions: |1> → |3>.
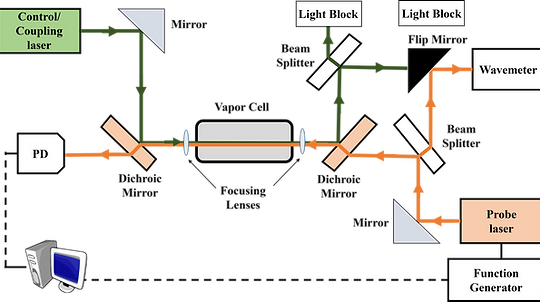
Figure 8: EIT experimental setup
Two counter-propagating probe (weak) and control lasers (strong) are overlapped inside the atomic vapor cell. Two converging lenses (optional) are used to focus the beams inside the cell. The control laser was kept at the resonance with |2> → |3> transition while the probe laser was scanned across the |1> → |2> transition. When the coupling laser is ON, the transparency window is observed in the probe absorption signal.
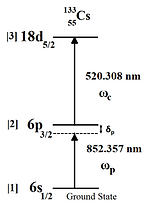
Figure 8: Cs ladder-type EIT scheme
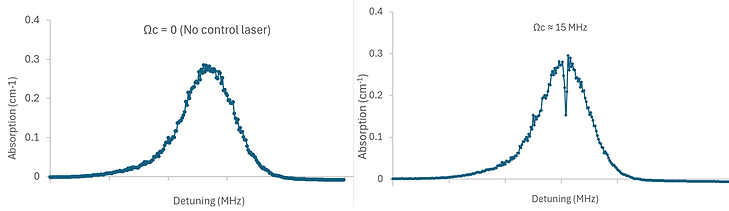
Figure 9: (Left) Probe absorption coefficient (α) vs probe frequency detuning (MHz) without the control laser is present. (Right) Probe absorption coefficient (α) vs probe frequency detuning (MHz) with the control laser is at resonance with the cesium |2> → |3> transition as indicated in Figure 8.